Hidden Line 3D graphics on an oscilloscope
A while ago I came across this project to display 3D graphics on an oscilloscope. I thought it would be fun to attempt the same thing but with hidden wireframe graphics and perspective projection (the original just shows all lines, and it doesn't seem to be doing a perspective projection). It turns out this is quite involved, not least of which because this (hidden line removal) is an area of 3D graphics which is now pretty obsolete - contemporary graphics is concerned with rendering every pixel with advanced lighting, whereas the goal here is to only show the lines making up the edges of polygons, while hiding those parts that are obscured by polygons closer to the camera.
What you can see below is progress to date on an implementation of Appel's algorithm, a method of determining which parts of a line are visible based on the notion of Quantitative Invisibility, as devised by Arthur Appel in the 60s. The image on the right is a SolidWorks rendering of a test object designed to be reasonably complex, and the image on the left is a rendering by my implementation of Appel's algorithm in Matlab. So far it's reasonably robust (or as robust as I need it to be), but it's pretty slow. The current goal is speeding things up a bit before attempting a C implementation. The challenge is in dealing with a number of so-called pathological cases which can arise, and which Appel rather glosses over. My implementation deals with these rather inefficiently at present (basically it identifies certain ambiguous cases, then does a brute force intersection test with every polygon to determine visibility of a vertex), hence the slow performance!
So where does the oscilloscope come in? Take a look at the site linked to at the top of the page to get the idea, but basically an oscilloscope can by used as an x-y display like a plotter, which makes it suited to drawing things made up of straight lines. At the moment the goal is getting the algorithm running at a decent speed before porting it to a small microcontroller and building the electronics to drive the oscilloscope.
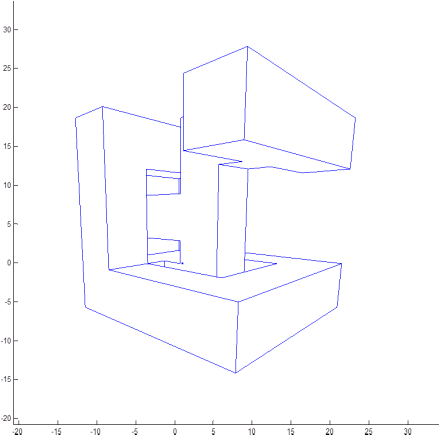
Hidden line rendering
|
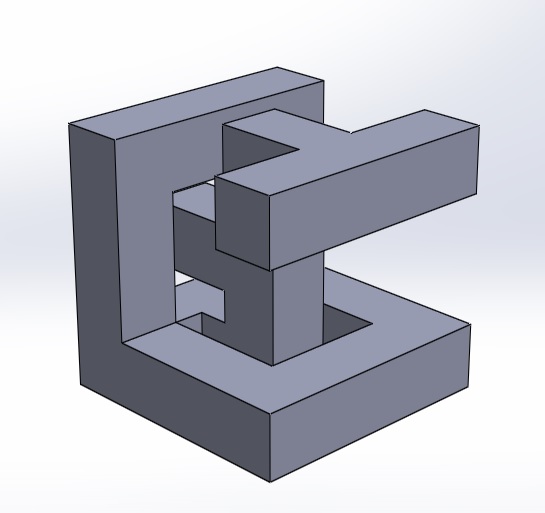
Original object as viewed in SolidWorks
|
